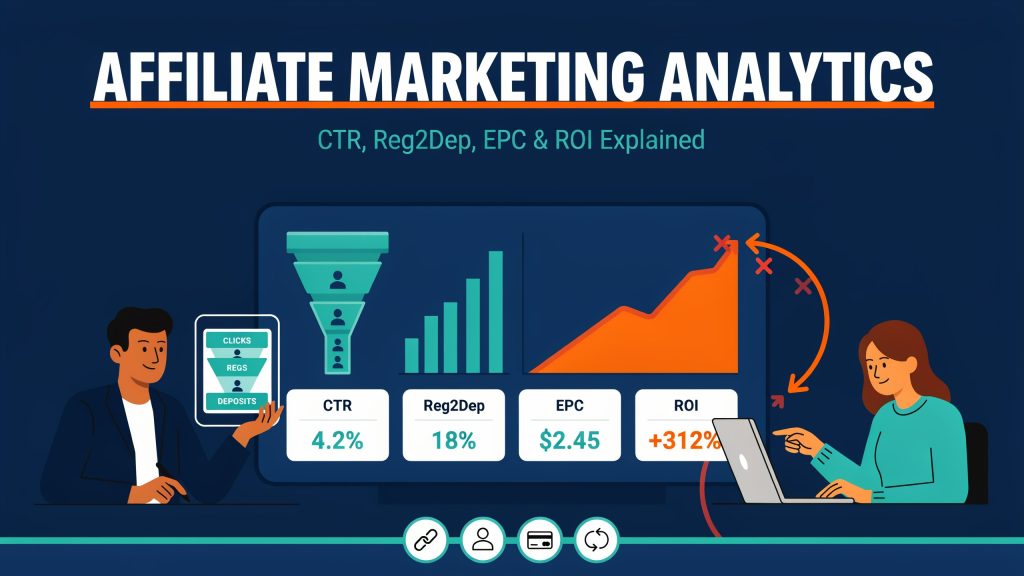
Most people who start out in affiliate marketing go through the same stage. Every morning, you open the dashboard and check the earnings column first. You’ll probably feel good or bad about it, depending on what it says. Then you close the tab without really knowing why the number went up or down. We did the same, and to be honest, we still look at earnings first, even though we know it’s the last number worth reading. By the time it changes, the real reason has already happened somewhere earlier in the chain, and you’re finding out about it a week too late.
This article’s about affiliate marketing analytics. It explains how we use it every day. It looks at the metrics that show what’s happening with traffic. It also looks at how these metrics connect to each other. It explains which things we pay close attention to and which things we don’t look at as often as we should. It’s for people who already send some traffic and have a stats page in front of them, but who want to read that page like a map that shows where things go wrong, so they can fix the right thing and stop guessing.
Why a single number never tells you enough
When it comes to affiliate data, think of it like a funnel. So, someone sees your link, clicks on it, gets to the advertiser’s page, signs up, makes a deposit or purchase, and then either comes back again or disappears for good. As long as you look at a tracker or partner dashboard, you’ll see that every metric describes one of these steps, or the move from one step to the next. So, when you look at them together, you can see where people drop off. But when you look at just one of them, it’s easy to get the wrong idea.
We learned the hard way when our income dropped a lot for a week. We spent most of that week swapping creatives and rewriting a couple of landing blocks. We thought the traffic had gone stale, but then someone finally looked at the conversion breakdown. They saw that clicks and sign-ups were fine, but deposits were down. The advertiser had an issue with one payment method in the country we were sending people from. After spending a week working on the wrong part of the project, I realised the answer was right under my nose the whole time.
The habit we try to keep (and don’t always manage to) is pretty simple. So, whenever the final number changes, just go back up the funnel step by step until you find the first place where the line breaks. Then you can start making changes. If you change three things at once without knowing which step broke, you’ll just end up with more confusion in the data you’ll need next week.
Traffic metrics: clicks, unique visitors and CTR
At the top of the funnel, you’ve got the numbers that show how many people you reach and how many of them are interested enough to click. The main ones here are impressions or page views, clicks, and click-through rate, which is just clicks divided by views. Beginners love these numbers because they’re easy to grow and move fast, but they don’t tell you much about money. A thousand clicks from people who were never going to sign up are worth less than a few clicks from people who were already looking for exactly what the advertiser offers.
One thing that’s easy to miss is the difference between raw clicks and unique clicks. If your tracker counts every click, then someone who opens your link from different tabs looks like several people. Also, bots, link preview crawlers in messengers, and some low-quality ad networks can make the raw count go up even more. This makes the numbers below it in the funnel look worse than they really are. If the gap between raw and unique clicks suddenly gets wider, it’s usually a sign that something non-human has joined the traffic. It’s way cheaper to get this sorted at the start than to spend ages trying to work out why your conversion rate’s gone down the pan.
We’ll admit that CTR is the metric we argue about most in the team. When it comes to SEO pages, we hardly ever take a look. This is because a link in the middle of a long article won’t tell us much about its effectiveness. But for paid creatives, it’s usually the first thing we check. This is because when people stop clicking on a creative, it’s usually the main reason a campaign slows down. We don’t compare our click-through rate (CTR) with the numbers people post on forums anymore. This is because placement, audience, and even the spot where the link sits on the page change it so much that there’s no fair benchmark to hold yourself to.
Conversion metrics: where interest turns into action
When people click on an advert, the next question is how many of them actually do what the advertiser pays for. Here, you usually see two or three separate rates depending on the type of advert. In e-commerce, it’s mostly about getting people to buy something after they click on an ad, while in iGaming and other products where people sign up first and pay later, the process is longer. So you look at how many people click on an ad and then sign up, and then how many of those people make a deposit, which many programs call Reg2Dep. If we had to pick one number to look at before all the others, it would be Reg2Dep and not EPC, even though EPC is the more complete metric. The reason is simple: when sign-ups stop turning into deposits, everything below that point is already broken, and a nice-looking EPC from last week won’t help much if this week’s registrations are empty. If you divide the process of converting a customer into a paying customer into different stages, you can see where things are going wrong. If people click on a link but then don’t fill in the form to register, the problem is usually the landing page or the fact that what your content promised doesn’t match what the person saw after they clicked on the link. If people register but then don’t make a deposit, the problem is more likely to be something to do with the payment methods, the verification process, or simply traffic that was curious but never planned to spend money.
There was also a timing issue that confused us at the start. If you register today, you might not pay until tomorrow or next week. This means that the numbers always show a lower conversion rate than the actual rate will be. Also, if you start a new campaign next to an old one, it will look worse because users will have had less time to act. The fix is simple: you judge every campaign after the same fixed time from the click. But in practice, we still get nervous around day ten and want to stop, so now we simply write the review date in the campaign name and try not to change anything before it.
Money metrics: EPC and ROI
EPC, or earnings per click, is still the number we check almost every time we open the stats, because it shows, at least roughly, how much one click is worth to us. It also lets us compare offers, pages and sources that have nothing else in common, since a click is a click whether it came from a blog post, a YouTube description or a push campaign. You can work out the ratio by dividing earnings for a period by clicks for the same period. This is a quick way to see which source is worth more effort.
The problem is that EPC depends on how you get paid and when the money actually arrives. With CPA, you get paid quickly after doing the qualifying thing. With RevShare, you get paid over months as people keep playing. Early EPC is almost always worse than later EPC. Most of our traffic runs on RevShare, and we used to switch off normal sources because of this. After a week and a half, we looked at them and saw a sad EPC. We decided they were weak, but then we realised that the players from those sources had actually been playing properly for a month. These days, we give a RevShare source a minimum of three or four weeks before we judge it, even when the early numbers look bad.
If you buy traffic, the second money metric you can’t skip is ROI, which shows how much you got back compared to what you spent. The math is easy, but the hard part is being honest about every cost, including the tracker, the creatives, the accounts or proxies, and your own time if this is your main job. When it comes to SEO, there’s usually no advertising spend, but there’s still a cost. This is the time spent writing and building links. Thinking of this time as an investment can help decide which pages need more work and which ones can be left alone.
Here is a short version of how we see the main metrics. We sometimes disagree with this table ourselves, because a measure that doesn’t matter for one source can decide everything for another. But as a starting point, it’s good.
| Metric | What it shows | What it can hide | When we check it |
| CTR | How well a link or creative catches attention | Whether those people have any real intent | When testing creatives, rarely for SEO |
| Click-to-registration | How well the landing and offer match the traffic | Whether new sign-ups will ever pay | After any change to content or landing |
| Reg2Dep | How many sign-ups become paying users | How much those users will spend later | First thing, every week |
| EPC | What one click is worth to us | Delayed RevShare income, one-off big wins | Weekly, to compare offers and sources |
| ROI | Whether paid traffic makes or loses money | Costs we forgot to count | Per campaign, after the review date |
| Player value (LTV) | What a user brings over their whole life | Anything about the next few weeks | Monthly, if we’re honest less often |
Quality metrics: retention, repeat actions and player value
Beginners usually skip this part of the data, but advertisers care about it the most. This is because, from their perspective, a user who makes one small deposit and leaves is often a loss, even if the affiliate was paid for bringing them. That’s why most programs look closely at what happens after the first action, like how many users come back for a second deposit, how long they stay active and how much they spend over their whole time with the product, which is what people mean by lifetime value, or LTV.
For an affiliate, these numbers matter in two different ways, depending on the model. With RevShare, you get paid directly, so a source with fewer deposits but loyal players can easily beat a source that brings lots of people who deposit once and then leave. CPA has less of an impact on them directly, but they do decide whether the deal continues. This is because programmes usually tie CPA payments to quality requirements. If users don’t meet these requirements, payments can be held or the rate reviewed. In the https://partners-pu.com/, for instance, the program’s own FAQ says CPA and hybrid deals come with traffic quality KPIs like a mandatory repeat deposit, while RevShare works without KPIs and pays for the player’s whole lifetime, which shows quite clearly how differently the two models look at the very same user.
We have to admit something here. We know LTV by country and by source should be checked more often than once a month. In some months, we skip it altogether. This is because while the deposits look normal, there’s always something more urgent to do. We don’t think you should try this. Every time we finally sit down with these numbers, we find at least one source that looked great in the first weeks but turned out to be quite average over time.
The other side of quality is the number of conversions that get rejected, reversed or charged back. When that share starts to grow, it’s important to pay attention, because it usually means some of the traffic is duplicated, incentivised or made up of people the offer was never meant for. Advertisers notice these patterns long before the affiliate does.
Matching what you track to how you get paid
Since the payment model changes which numbers drive your income, it helps to keep a short list in mind of what deserves the most attention under each one:
- Under CPA, it’s important to monitor how many leads convert into the desired action, the ratio of approved to rejected leads, and any key performance indicators (KPIs) set by the program. The income depends on each lead meeting these standards, and a single weak source can trigger a review of the entire account.
- Under RevShare, keep an eye on repeat deposits, how long players stay active and the value of each player over several months, and be patient with early EPC, since most of what a good player brings comes long after the first deposit.
- With a hybrid deal, you can watch both sides at once and pay extra attention to any volume requirements, because hybrid terms often expect a steady flow of first deposits, and the upfront part only works out if that flow keeps going week after week.
- In other words, if you’re using CPS or CPL in other areas, keep an eye on the average order value, refund rate and lead approval. This is because a refunded sale or a rejected lead is worth nothing, even if it looks good in your stats for a few days.
Segmenting: why averages lie
The average conversion rate or average EPC across all your traffic is not a good way to measure performance, because it mixes the best and worst sources and gives you an average that is not representative of any of them. When you divide the data into categories like source, country, device, page, or creative, you often see that most of the money comes from just a few of these categories. At the same time, some categories are losing money, which makes the average go down.
This is where sub-IDs come in. Most trackers and partner dashboards let you add extra information to a link. This means that each click can show the page, the placement, the campaign, or even the keyword it came from. Later, you can see conversions and earnings broken down by these tags. It takes some discipline to set this up from the first day (we skipped it on one of our early projects and then spent a long evening trying to guess which of twenty articles actually brought depositors), but without it you end up guessing instead of knowing.
The device and the country need to be considered separately, especially in the iGaming industry. The same offer can be very different in terms of how well it works on mobile and desktop devices. Also, a payment method that works perfectly in one country might not be available in another. After the payment issue, we have a simple rule: if a country has lots of registrations but few deposits, we write to our manager before spending any more money on that traffic. This is because the problem is often with the payment system and not the audience.
Tracking you can trust
All of these metrics are only as good as the data behind them. Often, strange numbers come from the tracking setup itself and not from the traffic. The best way to pass conversions is a server-to-server postback, where the advertiser’s system sends the event straight to your tracker. This is better than browser pixels because ad blockers or privacy settings can block them, or because they might miss the event when a user closes the tab too fast.
Even if you’re tracking well, your tracker and the partner dashboard will rarely show exactly the same numbers. This is normal as long as the difference stays small and doesn’t change much over time. Different time zones, different ways of counting unique clicks, different attribution windows and different moments when an action gets marked as approved all create small mismatches, so what we watch is a sudden change in the gap, which usually means something broke, like a postback URL that stopped working after an update on one of the sides.
It’s also good to be honest about what we can’t see from where we are. Affiliates only see what the programme chooses to show them. This means we usually don’t know exactly how net revenue is calculated after bonuses and fees, why a particular player stopped playing, or how the advertiser’s own emails and offers affect the users we send. This doesn’t make the data useless, but it does mean that some of our conclusions are educated guesses based on part of the picture. When a number looks off and we can’t explain it, it’s usually faster to send a message to the manager than to come up with our own theories.
How our week with the numbers actually looks
We don’t look at every metric every day, because doing that mostly leads to making decisions based on random swings, which can make you feel nervous. Our routine isn’t perfect and we break it regularly, but it roughly looks like this:
- On Monday, we open the tracker and the partner dashboard at the same time. We then check if the numbers have changed. If they are almost the same, we move on. But if they are not the same, we fix the tracking first. Then we think about the traffic.
- Then we go through Reg2Dep and repeat deposits by source, because that’s where the problems first show up for us, and anything that drops sharply gets a note and a closer look later in the week.
- EPC and clicks are used to decide where to put the week’s effort. Remember that on RevShare, a young source needs time before its EPC means anything.
- Once a month, or sometimes less often, we look at how long players stay and how much they’re worth. This is the only way to see which players are actually good and which ones only looked good at the start.
The earnings column will probably be the first thing we look at every morning, and we’re OK with that, as long as we can scroll back up through the funnel and find the step where the story actually changed.