Suppose you walk into a store, and you’re offered two smartphones. One costs $100 and makes $10 in monthly profit; the other costs $500 and makes $20 monthly. Which one’s a better deal? Investing in stocks works similarly, and the Price-to-Earnings (P/E) ratio helps decode these value puzzles.
The P/E ratio is one of the most popular tools investors use to determine whether a stock is fairly valued, overvalued, or undervalued. In this guide, we’ll break it all down—from definitions and formulas to real-world examples and pro tips—so you can feel confident using the P/E ratio in your investing journey.
What Is the Price-to-Earnings (P/E) Ratio?
Basic Definition
The Price-to-Earnings (P/E) ratio is a measure that tells you how much investors are willing to pay for each dollar of a company’s earnings. It’s a simple yet powerful way to assess whether a stock is expensive or cheap compared to its earnings.
Real-Life Analogy
Think of the P/E ratio as the price tag on a business. If you’re paying $50 for every $1 the company earns annually, that might be considered expensive unless the company is expected to grow rapidly. Conversely, if you’re paying $10 for every $1 in earnings, it might be a bargain—or it might be risky.
How to Calculate P/E Ratio (Formula Explained)
The Classic Formula
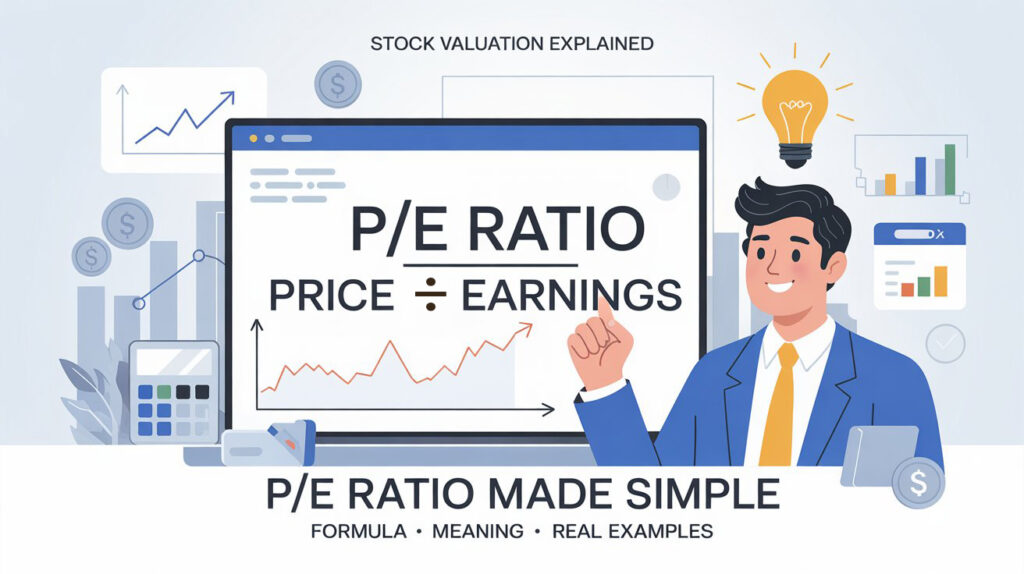
P/E Ratio = Market Price per Share / Earnings Per Share (EPS)
Breaking Down the Components
- Market Price per Share: The current trading price of one share of the company.
- Earnings Per Share (EPS): Net income divided by the number of outstanding shares.
Example Calculation
Let’s say:
- The stock price of XYZ Corp. is $100.
- Its earnings per share (EPS) over the last 12 months is $5.
P/E Ratio = $100 / $5 = 20
This means investors are willing to pay $20 for every $1 of XYZ’s earnings.
Types of P/E Ratios: Trailing vs Forward
Trailing P/E (TTM)
- Based on actual earnings from the trailing twelve months.
- Considered more reliable since it’s rooted in historical data.
- Might not reflect upcoming growth or risks.
Forward P/E
- Based on projected future earnings.
- Reflects market optimism or skepticism.
- Risky if analyst forecasts are inaccurate.
Tip: I usually look at both trailing and forward P/E to get a balanced view. One shows where the company was; the other shows where it might be going.
What Does a High or Low P/E Ratio Indicate?
High P/E Ratio
- Sign of investor confidence and expected growth.
- Often seen in tech or growth stocks like Tesla.
- Risk: the stock might be overhyped.
Low P/E Ratio
- Could indicate an undervalued stock.
- Might also mean the company is struggling.
- Risk: could be a value trap (looks cheap but for a reason).
I’ve been burned by value traps before, thinking a stock with a P/E of 7 was a steal—only to find out profits were falling. Always dig deeper! Look at other fundamentals, you can check chart patterns in addition for confirmation.
How to Use the P/E Ratio in Stock Analysis
Industry Comparisons
- Always compare P/E within the same industry.
- For example, tech firms generally have higher P/E than industrial companies.
Historical P/E Trends
- See how a company’s P/E has evolved over 5–10 years.
- Helps identify overvaluation or undervaluation relative to its own history.
Growth Context
- High P/E with strong earnings growth? Might still be worth it.
- Low P/E but declining profits? Red flag.
Limitations of the P/E Ratio
- Ignores growth: That’s why we have the PEG ratio.
- Earnings manipulation: EPS can be skewed by accounting tricks.
- Negative earnings: If a company is losing money, P/E is undefined.
Reality Check: P/E is just one tool in your investing toolbox. Don’t invest based on it alone.
P/E vs Other Valuation Metrics
P/E vs PEG Ratio
- PEG = P/E ÷ Annual EPS Growth Rate
- PEG < 1 = possibly undervalued
- Adds growth dimension to P/E
P/E vs P/B (Price-to-Book)
- P/B focuses on net asset value
- Useful for asset-heavy industries (e.g., banks)
P/E vs EV/EBITDA
- EV/EBITDA useful for debt-heavy companies
- Removes distortions caused by interest, taxes, and depreciation
Expert Tips on Interpreting the P/E Ratio
- Never use P/E alone
- Combine with ROE, Debt-to-Equity, and growth forecasts
- Understand market sentiment and economic backdrop
- Track how management guidance affects earnings expectations
Tools and Resources to Check P/E Ratio
- Yahoo Finance: Just search the stock name.
- Morningstar: Offers in-depth analysis and financial data.
- CNBC and MarketWatch: Great for quick checks.
- TradingView: For visualizing historical P/E trends.
Real Company P/E Analysis
Case 1: Apple Inc. (AAPL)
- P/E around 28
- High due to brand strength and consistent growth
Case 2: AT&T
- Low P/E compared to competitors
- Due to concerns about debt and future earnings
Case 3: Lyft
- Negative P/E
- Still not profitable; investors rely on future projections
Frequently Asked Questions (FAQs)
Q1. What is a good P/E ratio?
A: It depends on the industry. Generally, 15–25 is considered healthy.
Q2. Can a company have a negative P/E?
A: Yes, if it’s reporting losses. It means the stock has negative earnings.
Q3. Is a low P/E always better?
A: Not necessarily. It could signal issues with the business.
Q4. How often does the P/E ratio change?
A: Constantly, as stock prices and earnings updates come in.
Q5. Is P/E better than PEG?
A: PEG gives more context, especially for growth companies.
Is the P/E Ratio Enough?
The P/E ratio is a fantastic starting point. It helps you ask the right questions: Is this stock overvalued? Am I paying too much for future earnings? But remember, it’s only a piece of the puzzle.
The smartest investors look at multiple metrics, understand the business model, and consider both financial and non-financial indicators. Use P/E wisely, and pair it with your own judgment and analysis.

