Most of your buyers don’t see one ad, click, and buy. A typical journey looks more like this: someone sees your brand on TikTok, later searches on Google, reads a review, joins your email list, gets retargeted on Meta, and finally buys from a laptop a few days later. That’s 6–12 touchpoints across channels and devices for a single purchase.
Now think about what many marketers still do: open Google Analytics or an ad manager, look at last-click or platform-reported conversions, and give all the credit to the final click. In that world, the branded search ad or the last retargeting ad is the “hero,” and everything else is treated like a nice-to-have. You already know that is not how people really buy, but the reporting often pushes you back to that story.
Privacy changes have made this even worse. After Apple’s App Tracking Transparency (ATT) and similar updates, platforms started missing a big chunk of conversions because they could no longer track many iOS users end-to-end. Some analyses show that platform-native analytics can miss 30–40% of conversions due to iOS privacy, cookie limits, and cross-device journeys. So not only does last-click hide most touchpoints, in 2026 a lot of those touches are not even visible to the platforms you rely on.
Because of this, more marketers have embraced multi-touch attribution. MMA Global’s State of Attribution report found that by 2022, 53% of marketers were already using multi-touch attribution (MTA) to track and optimize their marketing performance, up about one-third from the previous year. A later 2025 guide estimated that around 75% of marketers were using some form of multi-touch model, reflecting how normal this has become in serious performance teams.
Here is in the short :
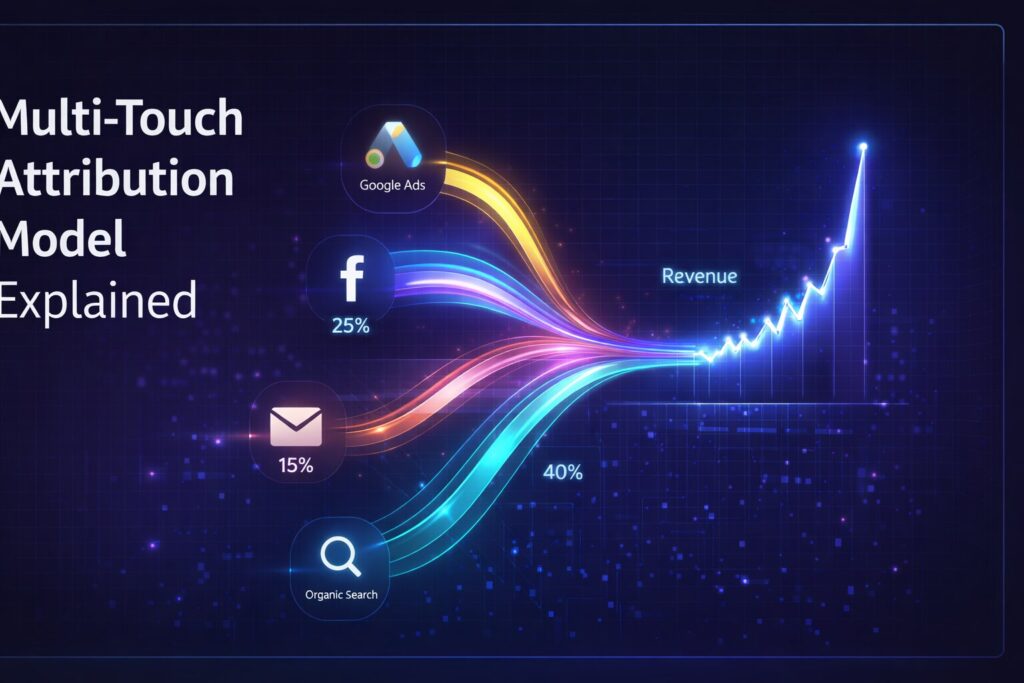
A multi-touch attribution model is a way of measuring marketing performance that looks at every touchpoint in a customer’s journey and gives each one a share of the credit for the final conversion, instead of giving 100% of the credit to a single click or channel.
In this guide, you’ll walk through what multi-touch attribution really is (in plain language), the main model types, how the tracking and math actually work, when to use which model, how MTA compares to other approaches like MMM and incrementality tests, the pros and cons in a privacy-first world, step‑by‑step implementation in 2026, the top tools, and a few real-world examples you can borrow for your own strategy.
A simple customer journey
Picture this journey for a single buyer:
-
Day 1: TikTok ad view → taps through, browses, leaves.
-
Day 3: Google search → search ad click → adds to wishlist, leaves.
-
Day 5: Email with 10% off → click → adds to cart, leaves.
-
Day 6: Facebook retargeting ad → click → completes purchase.
If you use last-click, Facebook gets 100% of the credit. If you use a simple linear multi-touch model, each of these four touchpoints gets 25% of the credit. If you use time-decay, maybe TikTok gets 10%, Google 20%, email 30%, and Facebook 40%.
That one change in how you assign credit can completely change how you move budget next month.
What is Multi-Touch Attribution?
Let’s break the idea down without jargon.
Multi-touch attribution is a way to measure your marketing where you give some credit to every meaningful touchpoint on the path to a conversion. A “touchpoint” can be an impression, a click, a page view, an email open, an app event, or even an offline interaction such as a store visit, as long as you can track it.
Instead of saying “this one click caused the sale,” you ask, “which touches helped, and how much did each one matter?”
How it’s different from first-click and last-click
You’re probably familiar with the classic single-touch models:
-
First-click: 100% of the credit goes to the first recorded touch, such as the first Google search click.
-
Last-click: 100% goes to the final touch before the conversion, such as a last retargeting ad.
-
Last non-direct click: similar to last-click, but it ignores direct traffic and credits the last non-direct channel (such as paid search or email).
These models are easy to understand and easy to explain to your boss. But in a world where a typical buyer sees your brand multiple times, they ignore most of the journey. That means top-of-funnel discovery and mid-funnel nurturing can look “weak” on paper, even if you’d stop growing without them.
Multi-touch attribution flips that idea:
-
It looks at all the touchpoints leading up to the conversion.
-
It applies a rule (linear, time-decay, U-shaped, W-shaped) or an algorithm (data-driven) to split credit across touches.
-
It then rolls that credit up by channel, campaign, and creative so you can make better budget and creative decisions.
Why multi-touch attribution became essential
You could get away with last-click ten years ago. In 2026, you probably can’t, at least not if you’re serious about performance. Here’s why:
-
Cross-device behavior is normal. A buyer might start on a phone, research on a laptop, then buy in an app or on a tablet. Old cookie-based tracking often fails to connect those sessions.
-
Privacy changes broke a lot of classic tracking. iOS ATT, Android privacy updates, and browser-level changes limit how you can track individuals with third-party cookies or mobile IDs. That means platform numbers alone have become less reliable.
-
Third-party cookies are going away. Chrome and other browsers are ending or heavily restricting third‑party cookies. That forces you to lean on first-party data, consented identifiers, and server-side tracking to keep any meaningful view of journeys.
-
You now run true omnichannel campaigns. It’s normal to run paid social, paid search, SEO, email, SMS, affiliates, influencers, and even TV or CTV at the same time. You need a way to see how those work together, not just who touched the ball last.
Multi-touch attribution, especially when rebuilt on first-party data and privacy‑safe identifiers, is one of the few practical tools you have to answer “what’s really working?” without violating privacy rules.
The main benefits in plain language
Here’s what you actually gain when you do multi-touch well:
-
A clearer picture of how people move from awareness to purchase instead of a single “winner” touchpoint.
-
A better handle on ROI by channel and campaign, so you can cut spend where it’s truly weak and back what quietly drives revenue.
-
The ability to spot “hidden heroes” like email or organic content that rarely get last-click credit but show up in most winning journeys.
-
A more realistic customer journey map that helps with creative, sequencing, and even on‑site UX decisions.
-
A common language for marketing, product, and finance to talk about performance and budget.
Before/after: single-touch vs multi-touch credit
Imagine one order worth 100 units of revenue, with four touches:
-
TikTok ad (view)
-
Google search ad (click)
-
Email click
-
Facebook retargeting click (last)
In a last-click model:
-
TikTok: 0
-
Google: 0
-
Email: 0
-
Facebook: 100
In a linear multi-touch model:
-
TikTok: 25
-
Google: 25
-
Email: 25
-
Facebook: 25
The journey didn’t change. Only your model changed. But that single change can flip next month’s budget from “cut TikTok, cut email, fund only retargeting” to “keep top-of-funnel and nurture healthy, but be realistic about retargeting.”
How Does a Multi-Touch Attribution Model Actually Work?
You can think of multi-touch attribution as two things working together:
-
A data pipeline that builds each customer journey.
-
A model that decides how to split credit across touches in that journey.
The data flow, step by step
Here’s what happens behind the scenes in most serious MTA setups:
-
Tracking events from every channel
-
Pixels, tags, SDKs, and server-side endpoints record when someone sees or clicks an ad, opens an email, views a page, adds to cart, or completes a purchase.
-
In 2026, more of this data is collected server-side and tied to first-party identifiers to get around browser and OS limits.
-
-
Collecting and unifying touchpoints
-
UTM parameters and click IDs label each event with source, medium, campaign, ad set, creative, and sometimes audience.
-
A CDP or data warehouse uses logins, hashed emails, device signals, and other hints to stitch events into journeys for users or accounts.
-
-
Linking conversions to past touchpoints
-
For each conversion (order, lead, signup), the system looks back over a set “lookback window” like 7, 30, or 90 days.
-
It pulls all eligible touchpoints in that window and filters out noise based on your rules (for example, exclude internal traffic or obvious fraud).
-
-
Applying the attribution model
-
A rule-based model (linear, time-decay, U-shaped, W-shaped) or a data-driven model (Shapley, Markov, or vendor-specific) decides how much credit to give to each touchpoint.
-
That credit can be in terms of conversions or revenue.
-
-
Rolling up the numbers
-
Individual touch credits are summed by channel, campaign, ad group, creative, or audience.
-
Dashboards then show you attributed revenue, ROAS, CPA, and LTV by slice, using the chosen model.
-
Key knobs you control
Under the hood, you have a few major settings you either set directly or choose via a tool:
-
Weighting rules
-
Linear: equal credit to each touch.
-
Time-decay: more weight near the conversion, less as you go back in time.
-
U-shaped / W-shaped: extra weight for first and last, or for first, lead creation, and last.
-
Data-driven: weights learned from the actual data using methods like Shapley values or Markov chains.
-
-
Conversion windows
-
How far back in time you’re willing to credit a touchpoint (7, 30, 90 days, etc.).
-
Short, simple purchases can use shorter windows; B2B deals usually need longer.
-
-
Scope
-
Whether you include only paid channels, or also direct, organic, email, SMS, referral, and offline.
-
Which events count as conversions (purchases, leads, free‑to‑paid upgrades, etc.).
-
-
Identity resolution rules
-
When two browser sessions should be treated as the same person.
-
When to use deterministic rules (logins, hashed email) and when to allow probabilistic matching based on device and behavior.
-
Common challenges you’ll hit
This all sounds neat, but in practice you run into some hard problems.
-
Identity in a cookieless world
-
Third-party cookies used to link behavior across sites. Those are going away or heavily restricted, so old cross-site tracking breaks.
-
Without good first-party identifiers (logins, email), the same person may look like a “new” user every time, fragmenting journeys and under-crediting channels.
-
Server-side tracking and identity graphs can recover a lot of this, but only when you collect the right data and users give you consent.
-
-
Data silos and bad tracking
-
Ad platforms, web analytics, apps, CRM, and offline systems often live in different tools.
-
Broken UTM tags, missing events, or mixed naming conventions pollute your paths and distort your model outputs.
-
-
Correlation vs. causation
-
MTA is great at telling you which touchpoints show up in journeys that end in conversions, but that is still correlation.
-
A channel might look strong in MTA simply because it overlaps with higher‑intent users, not because it causes lift.
-
To really prove lift, you still need incrementality tests like geo experiments or holdout tests, and you often want MMM (marketing mix modeling) on top for long‑term, aggregate calibration.
-
A simple formula you can quote
In a linear model, if a conversion is worth value V and there are n touchpoints, each touchpoint gets:
$$
\text{Credit per touch} = \frac{V}{n}
$$
For a basic time-decay model where touches that are closer in time to the conversion get more weight, you might use:
$$
w_i = e^{-\lambda t_i}
$$
Here ti is how many days before the conversion touch i happened, and λ controls how fast weight decays. You then normalize these weights so they add up to 1 and multiply by the conversion value.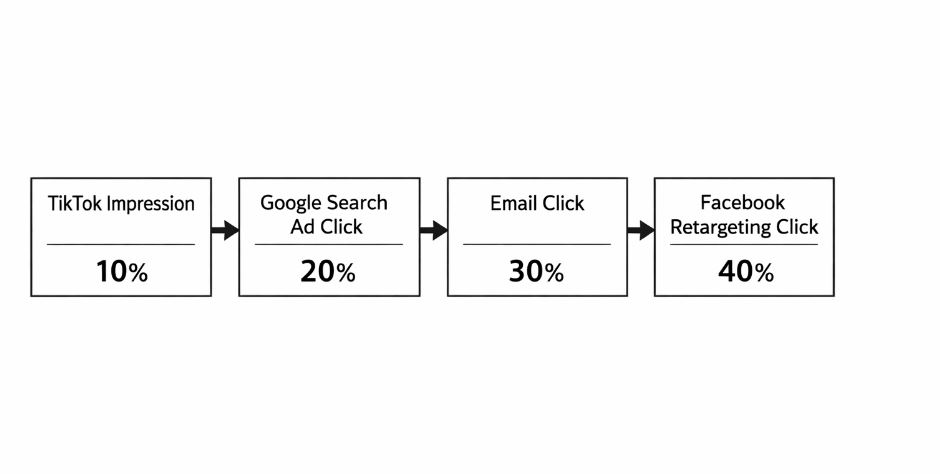
Customer journey with time-decay attribution
The Most Popular Multi-Touch Attribution Models in 2026
There are many ways to design a multi-touch model, but most real-world setups in 2026 boil down to a handful of patterns.
Quick comparison table
| Model | Credit Rule (plain) | Best For | Pros | Cons | 2026 Relevance |
|---|---|---|---|---|---|
| Linear | Equal share for every touch | New MTA users; balanced funnels | Simple, fair-looking, easy to explain | Overvalues small touches; ignores recency & role | High |
| Time Decay | More credit to touches near conversion | Short/medium cycles; retargeting-heavy | Rewards late-stage nudges; tunable | Underweights awareness; decay choice is subjective | High |
| Position-Based (U/W) | Extra credit to first/last or first/mid/last | B2B; lead-gen; long journeys | Highlights key milestones | Still rule-based; weights can be arbitrary | High |
| Data-Driven | Algorithm learns contribution from data | High-volume, multi-channel advertisers | Reflects actual behavior; adapts over time | Needs data & expertise; can feel like a black box | Very high |
| Markov / Shapley / Hybrid | Probabilistic paths + game theory | Complex portfolios; enterprises | Handles interactions & path differences | Complex, compute-heavy; vendor or data science help | Growing |
Now let’s go through each family in more depth, in the kind of length you’d use in your article.
Linear (even credit)
Linear is the “training wheels” model for multi-touch. It simply splits the credit equally between every recorded touchpoint.
If there are 4 touches, each gets 25%. If there are 10, each gets 10%. It doesn’t care what type of touch it is (view, click, email) or when it happened.
When linear works well for you:
-
You’re moving off last-click and need something easy that already feels fairer.
-
Your journey isn’t dominated by one special step; many touches pull roughly equal weight.
-
You want to quickly highlight channels like email, organic search, or content that never get credit in last-click views.
What’s good about linear:
-
It’s easy to explain to non-technical stakeholders: “we split the pie even.”
-
It automatically stops over-crediting the last step and starts valuing assists.
-
It usually reduces in-team fights over “who owns” the sale.
Where linear can mislead you:
-
It over-credits tiny or low-intent touches—like a single banner impression—if they show up in paths often.
-
It ignores the idea that some touches are more influential than others.
-
It fails when your funnel has very clear “big moments” (like lead creation) that matter more than surrounding touches.
Example:
A DTC skincare brand moves from Meta- and Google‑reported last-click numbers to a linear MTA model across all paid channels and email. They quickly see that email and organic search show up in most converting paths and deserve more love, even though almost all last-click credit previously went to retargeting ads.
Time Decay
Time-decay models assume that the closer a touchpoint is to conversion, the more influence it had. Early touches still matter but fade as time passes.
Think of it as a sliding scale: a click one day before purchase gets more weight than a click 20 days before, all else equal.
Good fits for time-decay:
-
Short to medium buying cycles where late nudges (retargeting, cart abandonment emails) are strong drivers.
-
Funnels where you suspect last-touch is too extreme, but you still want to heavily value late touches.
Why you might like it:
-
It feels intuitive; “the last few touches matter more” matches how many teams already think.
-
It reduces the risk that very early, forgettable touches take too much credit.
-
You can adjust the decay rate if your product has a longer or shorter cycle.
What to watch out for:
-
Choosing the wrong decay rate can produce weird results (for example, ignoring valuable awareness work).
-
It’s still a rule-based choice plugged into a formula, not a truth derived from data.
-
It can bias you toward short-term, lower‑funnel tactics at the expense of long-term brand building.
Example:
An online electronics store uses a 30‑day lookback and a time-decay MTA model. After ATT, last-click views made upper‑funnel Meta campaigns look terrible. With time-decay, they see these campaigns helping a large number of paths that end through branded search or direct visits. They keep scaling prospecting while still giving strong credit to retargeting and email.
Position-Based (U-shaped / W-shaped / Custom)
Position-based models care most about where in the journey the touch happens.
Two standard flavors show up in many tools:
-
U-shaped: often 40% of credit to the first touch, 40% to the last, and the remaining 20% split across the middle touches.
-
W-shaped: often 30% each to three milestones—first touch, lead creation, and opportunity or conversion—with 10% spread thinly across the rest.
You can think of U-shaped as “we value discovery and closing,” and W-shaped as “we value discovery, lead creation, and closing.”
When position-based is a good fit:
-
You have a clear lead or opportunity stage, like in B2B SaaS.
-
You know first touch and lead creation are major moments that deserve extra weight.
-
You want more nuance than linear but don’t have the data yet for data-driven modeling.
Pros:
-
Easy to align with how your sales and marketing funnel actually works.
-
Highlights important milestones that often get lost in last-click.
-
Customizable: you can adjust those 40–40–20 or 30–30–30–10 splits based on your reality.
Cons:
-
Those splits are still arbitrary; they might not match actual influence.
-
You can game the model by changing what counts as “lead creation” or “opportunity.”
-
It can be less intuitive in simple, short funnels.
Example:
A B2B analytics vendor defines “lead creation” as the first time a contact fills a demo form and “opportunity creation” as when sales logs a qualified opportunity in the CRM. They set up a W‑shaped model giving 30% credit each to first touch, lead creation event, and opportunity‑stage touch, with 10% across the rest. This quickly surfaces which campaigns and content types tend to create leads and which help push them into opportunities.
Data-Driven / Algorithmic (GA4, Adobe, ML models)
Data-driven or algorithmic attribution tries to let the data itself decide the weights instead of fixed rules. This usually means:
-
Looking at many journeys over time.
-
Testing how adding or removing a channel or touchpoint changes conversion odds.
-
Assigning more credit to touches that reliably move the needle.
Two families dominate:
-
Shapley value models: Based on game theory; they compare all possible combinations of channels to estimate each channel’s average marginal contribution.
-
Markov chain models: Treat each channel as a “state” and estimate how removing a channel affects the probability that users will reach the “conversion” state.
Google Analytics 4’s data-driven attribution and similar features in Adobe and others use related ideas under the hood.
When data-driven models shine:
-
You have a lot of conversions across multiple channels (thousands, not dozens).
-
You want to move beyond guesswork and see what the data says about touch influence.
-
You’re okay with a more complex, less transparent model.
Benefits:
-
They respond to real behavior, not just assumptions.
-
They can capture interactions, such as “Meta + search together is better than either alone.”
-
They update as your media mix, creative, and user behavior change.
Trade-offs:
-
They need strong data: volume, quality, and good identity resolution.
-
They are harder to explain to leadership: “the model said so” can be a weak story if you don’t have clear visuals and explanations.
-
You depend more on vendor tooling or your own data science resources.
Emerging: Markov Chain, Shapley, and Hybrid Models
Beyond what’s shipped in GA4 or standard tools, there’s a growing set of hybrid approaches:
-
Academic work shows that combining Markov chain models with Shapley values can produce more robust channel contributions than using either alone.
-
Some vendors build “visit scoring” or “total impact” models that mix MTA with conversion modeling and MMM ideas, especially in cookieless setups.
In practice, that can mean:
-
Running a Markov model to simulate the effect of removing each channel from journeys and measuring the drop in conversion rate.
-
Using Shapley logic to fairly distribute that drop among all channels that tend to work together in successful journeys.
-
Blending these results with business rules (such as “never give zero to branded search”) to make the output more stable and intuitive.
These hybrid approaches are still mostly in the realm of enterprise advertisers, advanced DTC brands, or vendors that serve them. But you’ll see them described with labels like “AI-powered attribution,” “incrementality-aware MTA,” or “cookieless multi-touch.”
Multi-Touch vs Other Attribution Approaches
Multi-touch attribution is powerful, but it’s not the only way—or even always the best way—to answer performance questions.
Simple comparison table
| Approach | What it looks at | Data you need | Where it’s strong | Where it’s weak |
|---|---|---|---|---|
| Single-touch | One touch (first or last) | Basic analytics tracking | Easy, fast, good for simple funnels | Misattributes complex journeys; fragile in privacy era |
| Multi-touch attribution | Multiple touches per journey | User/event-level data, IDs, tracking | Granular insights, digital optimization | Sensitive to data gaps; correlation not causation |
| Platform multi-channel | Touches inside one platform | Pixel/SDK data per platform | Day‑to‑day channel optimization | Siloed; double‑counts across platforms |
| MMM (marketing mix modeling) | Channel spend vs outcomes over time | Time series of spend + results | Strategic, covers online + offline | Coarse, slower feedback, needs stats expertise |
| Incrementality testing | Lift from experiments | Holdout/geo tests, experimentation | Causal answers for specific channels/campaigns | Costly, slower, narrow in scope |
Sources from Funnel, Haus, CaliberMind, and others all make the same basic point: you rarely want to pick just one method.
-
Use MTA for ongoing digital optimization and journey insight.
-
Use MMM for long‑term budget planning and to include offline and brand effects.
-
Use incrementality tests to validate lift for key channels or tactics and to calibrate your models.
When multi-touch fails you
You should know when multi-touch is the wrong tool, or at least a minor one:
-
Very short funnels: If most users see one ad and buy within minutes, the journey is so short that first-/last-click and MTA give similar answers. The overhead of MTA might not be worth it.
-
Offline-heavy businesses: If stores, phone calls, or field sales dominate and you can’t reliably link those interactions to digital IDs, MTA only sees a thin slice of your true journey.
-
Low-volume environments: If you have only a few hundred conversions a year, especially spread across many channels, any detailed model will be noisy.
-
Strict tracking limits: In some regulated spaces, you may not be able to collect enough user-level data for MTA to work well. In those situations, MMM and experiments at more aggregated levels may be your only safe options.
In those cases, you can still use multi-touch in pockets where it makes sense—such as certain digital-only campaigns—but you should not treat it as your main source of truth.
Benefits & Drawbacks of Multi-Touch Attribution Models
Benefits you can actually feel
When MTA is set up well, you’ll notice a few very practical changes:
-
More realistic ROI by channel. Instead of over-relying on “hero” channels that just happen to be last-touch, you see the real supporting cast and can budget around the whole team.
-
Better optimization decisions. You can see which campaigns and creatives consistently assist conversions, not just which ones are closer to the finish line.
-
Stronger story for budget and headcount. You can show leadership how brand campaigns, content, email, and nurture tracks contribute to revenue, even if they rarely “win” last-click.
-
Clearer journey insights. You see which sequences of touches work best, which helps you design better flows and experiences.
Real drawbacks you shouldn’t ignore
At the same time, there are reasons MTA sometimes gets a bad reputation:
-
Data-heavy and setup-heavy. You need clean tracking, identity resolution, and often a data warehouse or CDP layer. Getting there can take months.
-
Complex to implement and maintain. Even basic models demand careful scoping, and advanced ones require ongoing tuning and monitoring.
-
Privacy and compliance pressure. Collecting and combining user-level data triggers GDPR/CCPA obligations. You need consent flows, governance, and sometimes a data protection officer involved.
-
Risk of false confidence. It’s easy for teams to treat model outputs as “the truth” when they’re still just estimates based on what you can observe and how you configured the model.
-
Vendor frustration. Surveys show that even as MTA adoption has crossed 50%, many marketers still score MTA solution providers with negative Net Promoter Scores because of walled gardens, data-sharing limits, and implementation pain.
How 2026 tech softens the pain
The good news for you in 2026 is that the tooling has caught up in a few important ways:
-
Cookieless, AI-based modeling. Tools can now estimate “missing” conversions when users don’t consent to cookies, using conversion modeling and aggregate signals. This keeps your measurement usable when raw tracking is incomplete.
-
Server-side tracking as default. More platforms and vendors push server-side tracking, which greatly improves data completeness and identity resolution compared to client-only pixels.
-
Stack-based measurement. Modern teams increasingly combine MTA, MMM, and incrementality tests instead of betting everything on one method, using each where it makes the most sense.
How to Implement Multi-Touch Attribution in 2026
Here’s a practical sequence you can follow or present to your readers.
Step 1: Audit your current tracking
Start where you are:
-
Check that key events are tracked correctly in Google Analytics 4 (or your main analytics), including purchases, lead form submissions, and important micro-conversions.
-
Review all your pixels and SDKs for Meta, Google Ads, TikTok, etc. Make sure there’s no double-counting and that events fire reliably.
-
Inspect UTM conventions across your channels so you don’t have “Paid_Social,” “paid-social,” and “psocial” all meaning the same thing.
If your base tracking is broken, no model can save you.
Step 2: Strengthen first-party and server-side tracking
Given privacy and browser limits, this is now non-negotiable:
-
Encourage logins and first-party data capture where it makes sense (accounts, wishlists, loyalty programs).
-
Implement server-side tracking, such as Meta’s Conversions API, Google’s server-side tagging, or similar solutions. This helps you send clean events from your servers instead of trusting every pixel in every browser.
-
Add or tune a consent management platform (CMP) so you capture and respect user choices on analytics and marketing cookies.
This step sets the foundation for any serious multi-touch work.
Step 3: Choose the right model for your stage
Don’t jump directly to the fanciest algorithm. Match the model to your maturity:
-
If you’re small or just starting: begin with linear or simple time-decay in GA4 or your attribution tool.
-
If you’re B2B or have long consideration: test U-shaped or W-shaped models that emphasize first touch and lead creation.
-
If you’re high-volume and data-rich: plan a roadmap toward data-driven models, either via GA4’s data-driven attribution or a specialized platform.
You can always add complexity later.
Step 4: Pick a tool or platform
Your options, in plain language:
-
GA4 / Adobe Analytics: Good starting points. They provide built‑in models, including data-driven options in certain tiers.
-
Specialized MTA tools: Platforms like SegmentStream, Northbeam, Rockerbox, Triple Whale, Fospha, ThoughtMetric, and Cometly focus specifically on attribution for ecommerce and DTC, often with extra features such as visit scoring, MMM add‑ons, and identity graphs.
-
Custom warehouse model: If you already have a modern data stack (BigQuery, Snowflake, etc.), you can build your own models or work with vendors that sit on top of your warehouse, such as CaliberMind or Haus.
When comparing tools, look closely at:
-
Which models they support.
-
How they handle cookieless tracking and first-party data.
-
What integrations they have with your current stack.
-
Who owns the data and how transparent the methodology is.
Step 5: Configure windows, scope, and rules
Fine-tune your implementation:
-
Set lookback windows for each conversion type (for example, 7 days for low-ticket items, 30–90 days for higher-ticket or B2B).
-
Decide if you’re including organic, direct, and email, or starting with paid-only and expanding later.
-
Exclude internal traffic, known bots, and obviously bad data.
-
Define exactly what counts as a “lead,” “opportunity,” and “conversion” so your model aligns with how sales and finance think.
Step 6: Test and validate
Before you let MTA drive big budget moves, sanity-check it:
-
Run your new model in parallel with last-click and see which channels gain or lose credit. Ask if those shifts match how your funnel feels.
-
For key channels, run incrementality tests—such as geo experiments or audience holdouts—to see whether increasing spend actually increases conversions in the real world.
-
Where possible, line up attribution results with MMM or higher‑level financial reports to keep everything grounded.
Step 7: Monitor, iterate, and educate
Once live, treat your MTA setup as a product, not a one‑time project:
-
Review attribution dashboards weekly or monthly and adjust campaigns based on consistent patterns, not one-week spikes.
-
Refine your model choice or windows if you see clear misalignment (for example, awareness campaigns clearly helping, but always under-credited).
-
Teach your team what the model can and cannot say. Emphasize that MTA is an improved estimate, not a perfect truth.
Best Multi-Touch Attribution Tools & Platforms in 2026
Tool landscapes change fast, but several names come up again and again in 2026 roundups, especially for ecommerce and DTC brands.
Quick comparison table
| Tool / Platform | Pricing Band (typical) | Best For | Data-Driven? | Cookieless Strength (high‑level) |
|---|---|---|---|---|
| GA4 | Free; GA4 360 is paid | Baseline analytics + attribution | Yes (in some tiers) | Uses consent + server-side options |
| Adobe Analytics | Enterprise | Large enterprises, complex setups | Yes | Strong with full enterprise setup |
| SegmentStream | Mid-market, enterprise | Cross-channel ecommerce & DTC | Yes (visit scoring) | Privacy-first, first-party architecture |
| Northbeam | Mid-market DTC | Shopify & DTC paid media | Yes (proprietary) | Uses pixel + server-side tracking |
| Rockerbox | Mid-market, enterprise | Digital + offline, MMM & experiments | Yes | Strong offline + MMM integration |
| Triple Whale | SMB & mid-market Shopify | Shopify-native attribution & insights | Yes | Triple Pixel server-side tracking |
| Cometly | SMB & mid-market | Paid media tracking and attribution | Some modeling | Focused on first-party data & CAPI |
| Fospha / ThoughtMetric | SMB & mid-market ecommerce | Revenue-focused MTA | Yes in some tiers | Varies by vendor; check cookieless docs |
SegmentStream’s own 2026 list highlights SegmentStream, Northbeam, Rockerbox, Triple Whale, Fospha, ThoughtMetric, and Cometly as leading multi-touch attribution tools for ecommerce and DTC, each with different strengths and trade‑offs. Other reviews emphasize server-side tracking, identity resolution, and incrementality features as key buying criteria.
Here’s how you might position them to your readers:
-
GA4: Use this as your default starting point. Turn on and compare its attribution models, including data-driven, before you buy anything. It’s not perfect, but it’s free and deeply integrated into many stacks.
-
Adobe Analytics: Overkill for most smaller brands, but a strong choice if you’re already an Adobe shop and have enterprise resources to implement it.
-
SegmentStream: Strong if you want cross-channel attribution with advanced modeling, including visit scoring and conversion modeling, and if you care a lot about data ownership and privacy-first architecture.
-
Northbeam: A popular choice for Shopify and DTC brands that want a unified, paid‑media‑heavy view and can invest in a dedicated tool.
-
Rockerbox: Positioned for brands that want multi-touch, MMM, and experiment support in one place, including offline media.
-
Triple Whale: A go‑to in the Shopify world, with multiple model options, server-side Triple Pixel, and “Total Impact” models that blend survey and multi-touch data.
-
Cometly, Fospha, ThoughtMetric: Good fits for smaller to mid-market teams needing more than platform numbers but not yet ready for full enterprise stacks.
When your readers pick tools, push them to think beyond features and ask:
-
Who owns and controls the data?
-
How does the tool behave in a cookieless, high‑privacy world?
-
How transparent is the methodology?
-
Does the tool fit their channel mix and team skills?
Real-World Examples & Case Studies
You can’t always share exact numbers, but you can still tell useful stories.
Example 1: Ecommerce brand fixes “Meta is dead” panic
A mid-sized DTC clothing brand saw Meta‑reported conversions drop sharply after ATT. Last-click and platform dashboards said prospecting campaigns were losing money, so the team cut budgets there and poured more into retargeting and branded search. Revenue plateaued, then started slipping.
They implemented a server-side tracking setup plus a time-decay MTA model through a tool like Northbeam or SegmentStream. After a few weeks, they noticed:
-
Prospecting campaigns rarely showed as last-click but appeared early in most high‑value paths.
-
Email and organic search played a strong role in mid-funnel, even when they did not close the sale.
-
Retargeting and branded search still mattered, but they were riding on top of earlier touches.
Armed with this, they shifted about 20–30% of budget back into top‑of‑funnel and email while keeping but right‑sizing retargeting. Over the next quarter, both revenue and blended ROAS recovered as they stopped starving the campaigns that actually started journeys.
You can visualize this with two bar charts in your article:
-
Before: budget heavy on retargeting and branded search.
-
After: more spread between prospecting, email, and retention.
Example 2: B2B SaaS uncovers email’s true influence
A B2B SaaS company sold a mid‑ticket product with a 3–6 month sales cycle. Their CRM and last-touch reports showed that most deals came from “direct” or “sales email,” making marketing look like a cost center.
They built a W‑shaped MTA model on top of their data warehouse with help from a vendor similar to CaliberMind or Haus. They:
-
Pulled in paid ads, content, webinar attendance, email campaigns, and CRM sales activities.
-
Defined key milestones: first touch, MQL creation, and opportunity creation.
-
Gave those milestones extra credit, with smaller credit for other touches.
The results showed that:
-
Content and webinars drove most first touches and many MQLs.
-
Email nurtures, often from marketing not sales, were present in the majority of won opportunities.
-
Sales touches still mattered a lot but weren’t the whole story.
This let marketing argue for more budget and headcount for content and lifecycle, backed by a model sales could see and understand. Over time, they used these insights to tune nurture sequences and content topics, improving both close rates and deal size.
Example 3: Cookieless MTA with first-party data
Brands working with cookieless MTA vendors like Factors or privacy platforms like Usercentrics rebuilt their attribution on first-party data.
What changed:
-
They rolled out better consent flows and login strategies to collect usable identifiers with user permission.
-
They moved tracking to the server and used identity graphs to link sessions where possible.
-
They used conversion modeling to estimate contribution from users who did not consent to cookies.
This did not restore 100% of the old view, but it gave them a working, privacy‑safe multi-touch model that let them keep optimizing across channels even as third-party cookies disappeared.
Frequently Asked Questions
Use these as FAQ entries and schema.
1. What is the difference between multi-touch and multi-channel attribution?
Multi-touch attribution looks at all touchpoints within an individual user or account journey and splits credit between them. Multi-channel attribution is a broader term that can refer to any method of splitting credit across channels, even if it still uses single-touch rules inside each channel. In practice, multi-touch is a specific, user-level technique; multi-channel is the bigger umbrella.
2. Is multi-touch attribution still relevant in a cookieless world?
Yes, but it has to be rebuilt around first-party data, consented identifiers, server-side tracking, and privacy‑safe modeling instead of third-party cookies. Many vendors now offer “cookieless MTA” that uses anonymous event streams, identity graphs, and conversion modeling to keep journeys measurable while respecting privacy.
3. Which multi-touch model is best for ecommerce?
It depends on your size and complexity:
-
Smaller and mid-sized stores often start with linear or simple position‑based models because they’re easy to understand.
-
Brands with a lot of retargeting often like time-decay because it emphasizes final pushes.
-
Bigger, high-volume stores often graduate to data-driven models in tools like SegmentStream, Northbeam, Rockerbox, or Triple Whale.
The right answer is the one that fits your funnel length, data, and team skills.
4. How is multi-touch attribution different from Google Analytics 4?
Google Analytics 4 includes multi-touch attribution models, including a data-driven option that uses machine learning to assign value to touchpoints. So GA4 already gives you a basic MTA engine. The main differences are:
-
GA4’s model is limited to the data it collects and the channels it can see.
-
Dedicated MTA tools often combine more sources (including offline) and offer more control and transparency.
Many teams treat GA4 as a starting point, then add a specialist tool when they need more depth.
5. Does multi-touch attribution replace MMM (marketing mix modeling)?
No. MTA and MMM solve different problems:
-
MTA: user-level, short‑term, mostly digital, great for day‑to‑day optimization.
-
MMM: aggregated, long‑term, covers all channels including offline, good for strategic budget decisions.
More advanced teams run both and use MMM and experiments to calibrate their MTA.
6. Can multi-touch attribution handle offline channels?
To a point. If you can match offline events (like call center logs or in-store visits) to digital IDs, you can add them into your multi-touch paths. But offline coverage will rarely be complete, so MMM and incrementality tests remain key for truly offline-heavy businesses.
7. How much data do I need before multi-touch attribution is useful?
You can use simple, rule‑based MTA even with modest data, as long as tracking is clean. Data‑driven models (like Shapley or Markov) generally need thousands of conversions across multiple channels to avoid noisy results. Most vendors can give you a sense of what “enough” looks like for their specific models.
8. How “accurate” is multi-touch attribution?
MTA can be very useful for relative comparisons (“channel A tends to help more than channel B”), but it is still an estimate built on observed data and modeling assumptions. Tracking gaps, unseen offline behavior, and self‑selection all limit how exact it can be. This is why combining MTA with experiments and MMM is so powerful.
9. What role does identity resolution play in MTA?
Identity resolution is the engine that turns separate sessions into actual journeys. If you have strong identity resolution—using logins, hashed emails, and server-side event streams—you can see more of the path and credit channels more fairly. If identity is weak, journeys fragment, channels look less effective, and your model’s value drops.
10. Is multi-touch attribution only for big companies?
Not anymore. Enterprise tools dominated early, but today there are many MTA options aimed at SMB and mid‑market brands, including Shopify-focused tools and GA4’s built‑in models. The biggest barrier is not company size but having clean data and a team willing to learn and act on the insights.
11. How should I treat platform-reported conversions vs my MTA numbers?
Platform-reported conversions (from Meta, Google, etc.) often use their own attribution windows and may over- or under‑report, especially since ATT and cookie changes. MTA, when done well, deduplicates and unifies conversions across platforms. Many teams treat platform numbers as optimization signals within each platform and use MTA as the cross‑channel “source of truth” for budgeting.
12. How do I know if I’m ready to move beyond last-click?
You’re likely ready for multi-touch if:
-
You spend serious money across several channels.
-
You feel stuck in budget debates because last-click and platform numbers don’t match your instincts.
-
Leadership is asking hard questions about what actually drives revenue.
-
You already have (or plan to build) decent analytics, CDP, or warehouse capabilities.
If that sounds like you, starting with GA4’s attribution and then layering a specialized tool is a natural next step.
Conclusion
Multi-touch attribution will not magically solve every measurement problem in 2026, but it is one of the most practical moves you can make if you want to stop flying blind with last-click and broken pixel data. When you base it on first-party data, server-side tracking, and realistic models, it gives you a far more honest view of how your channels and touchpoints work together to create revenue.
If you want to get started without getting overwhelmed, begin with what you already have:
-
Audit your current model in GA4 or your main analytics tool. Switch from pure last-click to a multi-touch or data-driven model and see how your channel story changes.
-
Fix your tracking and UTM discipline, and move toward server-side tracking where you can.
-
Once your foundations are solid, explore dedicated tools that fit your size and stack, especially if you’re a DTC or ecommerce brand that needs deeper insight than GA4 alone can provide.
From there, layer in MMM and incrementality tests over time. Together, these methods give you a flexible “measurement stack” that can survive privacy shifts, walled gardens, and new channels—while still helping you answer the question that matters most: which parts of your marketing are truly driving results, and where should you put the next dollar.